This page contains summary results and visualizations of our study into consumer behavior.
In order to gain insight into how big data can offer ecommerce companies greater opportunity to drive sales and revenue,
we leveraged machine learning algorithms to analyze Amazon customer data.
Our research had 3 goals:
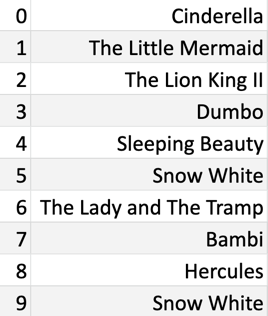
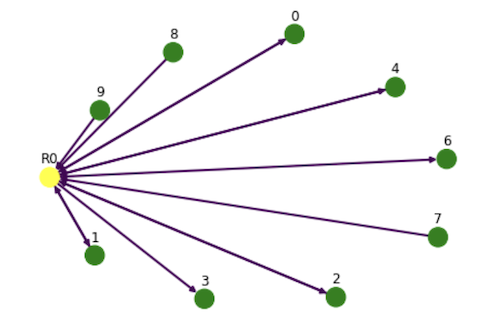
The Apriori algorithm is used for mining frequent item sets and relevant association rules from relational databases. The parameters “support” and “confidence” are utilized, support are the items’ frequency of occurrence and confidence is a conditional probability. The goal of the analysis is to identify items bought together and show them in the ecommerce website to increase cross sell and sales.
In the table below, the top 2 results of each product category are shown. Only music and videos had a confidence higher than 60%, but since the only downside is showing recommendations that a consumer might not have interest on and the upside is increased sales, the risk is low of showing results with lower confidence.
| Segment | Antecedent IDs | Antecedent Names | Consequent IDs | Consequent Names | Confidence |
|---|

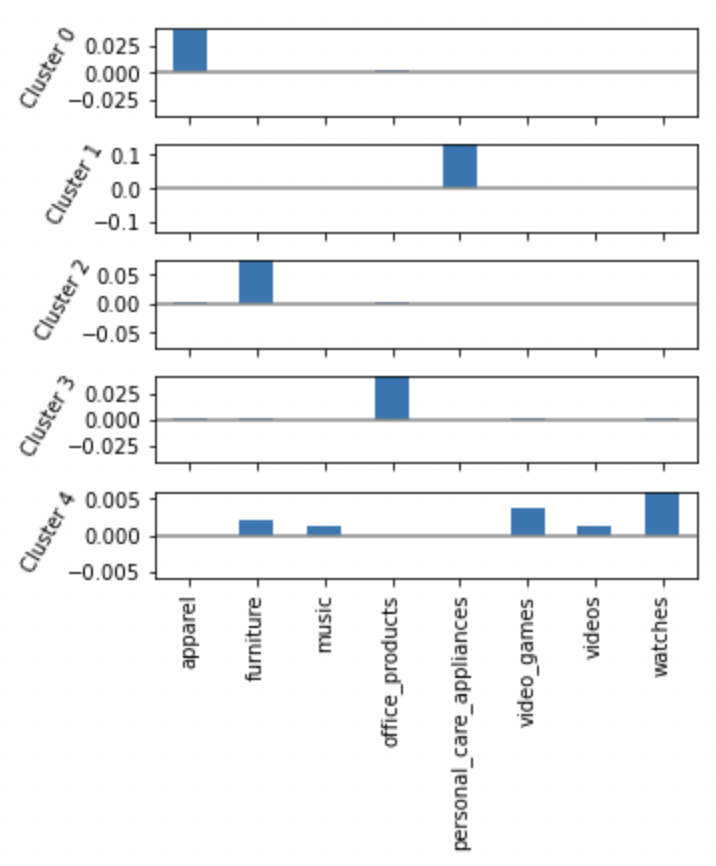
Based on data of eight different product categories; apparel, furniture, music, watches, personal care, office products, video and video games; the data was consolidated based on the product quantities bought from each segment by customer. The K-means cluster analysis was the machine learning used, since it is an unsupervised model that groups data into clusters, or in this case, customer segments.
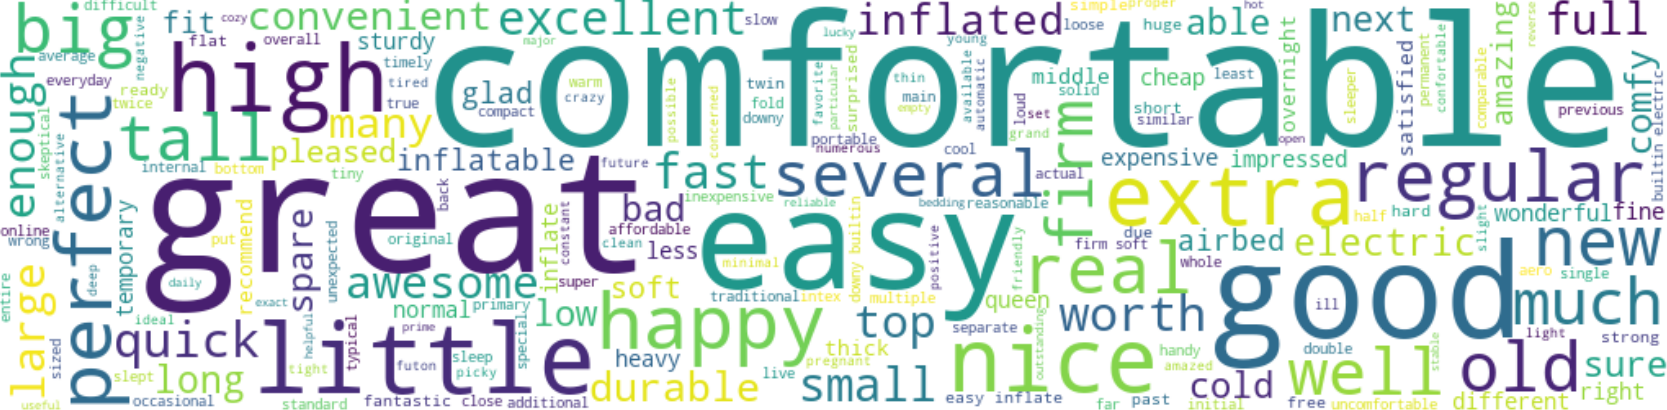
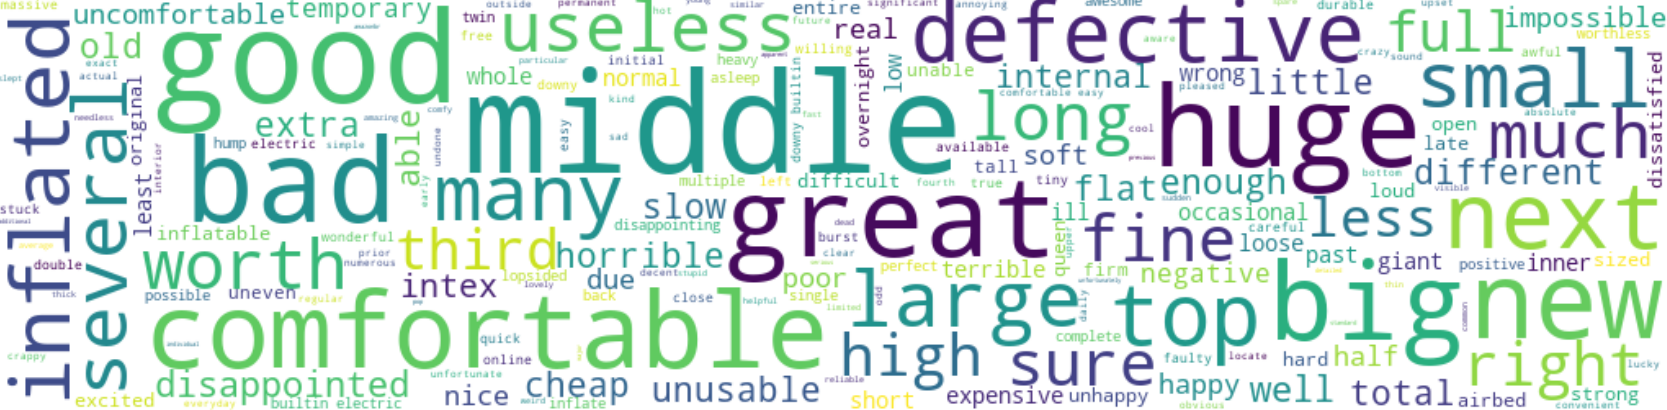
For this analysis one specific product was selected, Product ID B000M0MJU2, an air mattress. The Latent Dirichlet Allocation (LDA) machine learning model was used to identify topics with the customer reviews. To better interpret the data, the analysis was split into bad (1-star) and good (5-stars) reviews.
The bubble charts below represent the output of the analysis, each bubble represents a different topic, the larger the bubble, the higher percentage of the number of reviews in the corpus of the topic. The blue bars show the overall frequency of each word in the corpus, if no topic is selected, the blue bars display the most frequently used words. The red bars give the estimated number of times a given term was generated by a given topic. The further the bubbles are away for each other, the more different they are.